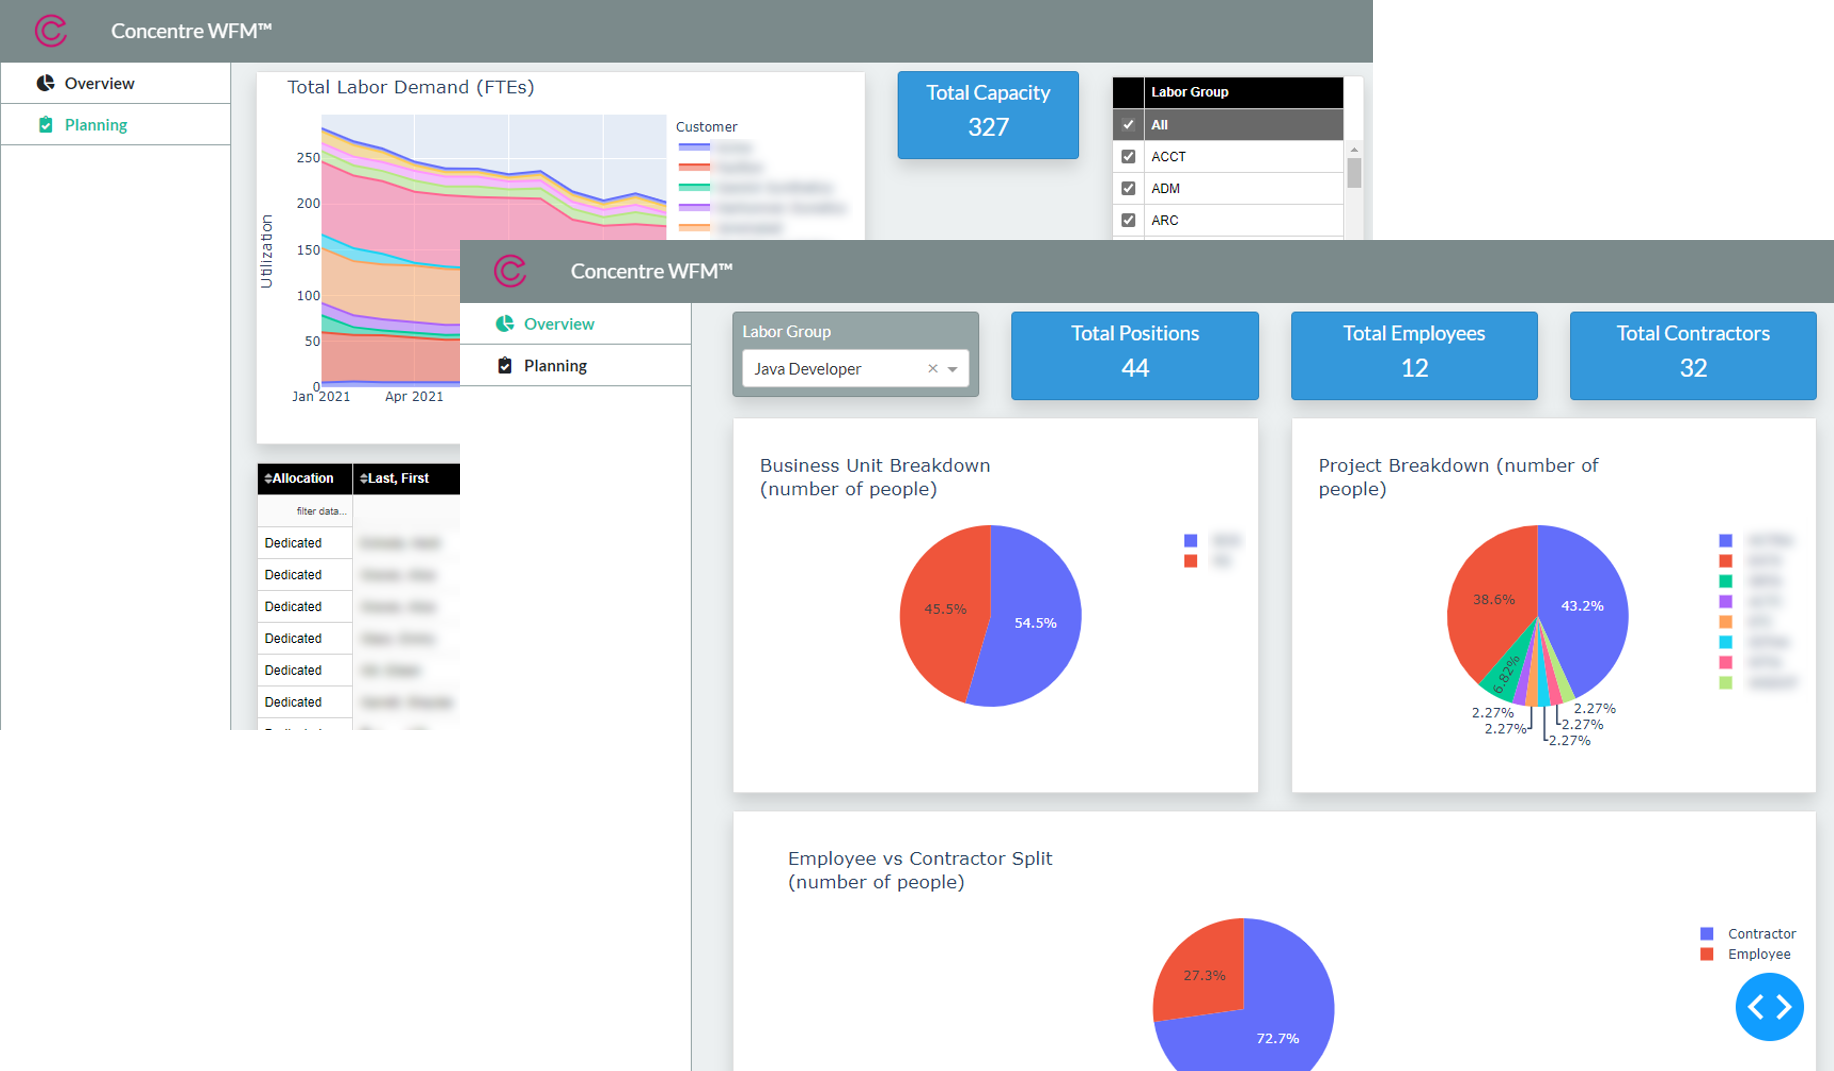
Many companies seek to become more “data driven.” But not all data is created equal and “all data” can be an overwhelming amount of noise. We pursue a decision-driven approach with our clients to ensure that the right data and metrics are prioritized to be impactful to the enterprise.
In recent years, data has often been called the “new gold” or the “new oil” in reference to the enormous value and/or potential to power businesses today. With this characterization, it is not surprising that many companies have launched major efforts to better manage and harness data to capture value. Transformation initiatives that previously focused on implementation of new business processes and information management systems such as ERP, CRM, and HRIS now seek to build on this transactional foundation by rolling out new data repositories (including data warehouses and data lakes), self-serve analytics platforms, and AI and predictive analytics solutions.

While these transformation initiatives can bring major new capabilities and associated benefits to companies, I often meet with companies where the increased access to data simply overwhelms business leaders with a chaotic and inconsistent mix of spreadsheets, numbers, and cluttered dashboards while not providing real insight to drive effective decision making.
Over the last several years, I have worked with multiple clients to help them use data to improve decision making in making pricing and transaction structuring decisions, improving operations management, facilitating workforce planning and resource allocation, and more. Like most modern firms, my clients have rich data and information that could theoretically help them do a better job of structuring transactions or staffing client and internal projects. But when faced with sprawling spreadsheet and PowerPoint presentations with a never-ending parade of tables and numbers, it remains easier to simply default to heuristics and standard operating procedures and simply continue to do things as they always did them. It may not lead to the best decisions, but the decisions were made and got the job done acceptably, though not optimally.
Unfortunately, standard heuristics and operating procedures are increasingly out of date as companies struggle to stay ahead of competitors and maintain profitability in an incredibly dynamic business context. More sophisticated competitors continually improve service levels and reduce costs while companies that are stuck in the past miss major opportunities to better serve customers while enhancing performance and profitability.
While sorting through the crush of available data can seem daunting, using data to make better business decisions is not rocket science. As is almost always the case, better, data-driven decisions come back to the usual basics:
- What is the real problem to be addressed? Absent a clear understanding of the problem to be solved and the audience, a mass of data simply increases confusion. While a program manager may need to understand progress and profitability on individual tasks and have a clear view of every project in a pipeline, corporate HR leadership may need simply to understand gross capacity in different skillsets and which programs have the highest demand for that skillset. Similarly, a location manager may need to better manage her transaction pipeline to improve resource utilization, while the CFO may need a clearer understanding of overall cost and pricing trends across the company and why specific locations are out of sync with those trends.
- What are the key metrics? With today’s information systems, managers and executives can rapidly and affordably collect data on a vast array of metrics. But which metrics are most important for addressing the core problem? Are profitability challenges in a given market driven by rising costs or reduced pricing leverage? Are utilization challenges a problem for all customers and labor classes, or is it in specific areas and with specific skill sets? Metrics are just math on base data. The real challenge is getting decision makers to agree on the most important metrics to focus on.
- How can I quickly get the big picture and drill down where needed? While detailed data can be critical for making narrow, tactical decisions, senior business leaders typically need to get a good sense of the context and then drill down on specific indicators to understand where their decisions can have the most impact on needed outcomes. This is where a picture is worth a thousand words dollars. An effective visual representation of pricing dynamics can help executives quickly grasp the relative importance of different categories to see that a 5% price increase in one category can be far more important than a price doubling in an uncommonly used item … or vice versa. Or that, in an HR context, while one program may be grossly understaffed in one labor category, the company overall is more than adequately staffed and should work across programs to better share resources.
As I work with clients I often find that, while companies are rapidly improving their data management capabilities, this focus on the basics of problem definition and effective communication are increasingly the real differentiators for improving company performance. And to really move the needle, effective data visualization grounded in a solid understanding of the core problem and the key metrics is critical. As such, we increasingly work with clients to turn sprawling data models into highly visual and interactive dashboards with compelling storyboards that help executives quickly understand issues and drill down to targeted solutions. Better insight on pricing, for example, helped one client improve EBITDA margins by more than 5%, while quickly seeing workforce capacity vs project demand helped another optimize resource allocation while saving millions in excess labor costs.


